You have run RNA-seq. You have fold changes, p-values, and maybe a volcano plot that looks perfect. Then comes the hard question:
What biology does this actually mean?
This is where functional enrichment comes in. Functional enrichment helps translate gene-level statistics into biological insight. The three names people usually hear are GO, KEGG, and GSEA. They are often treated as competitors, but in reality they do very different jobs.
Understanding how they differ makes enrichment analysis much easier and much more meaningful.
First, How Functional Enrichment is Actually Done
In real RNA-seq workflows, enrichment is performed using two main statistical approaches:
- Over-Representation Analysis (ORA)
- Functional Class Scoring (FCS), most commonly implemented as Gene Set Enrichment Analysis (GSEA)
Important distinction: GO and KEGG are not methods. They are collections of gene sets. ORA and GSEA are the methods used to test those gene sets.
Keeping this distinction in mind avoids most confusion.
GO Enrichment: What Do My Genes Do?
Gene Ontology (GO) focuses on gene function. It describes what genes do, where they act, and which biological processes they belong to.
GO answers questions such as:
- Which biological processes are changing?
- Which molecular functions are enriched?
- Where in the cell is activity occurring?
GO is organized into three branches:
- Biological Process (for example, immune response)
- Molecular Function (for example, kinase activity)
- Cellular Component (for example, mitochondrion)
GO enrichment is most commonly performed using ORA. This means it uses a list of differentially expressed genes and asks whether certain GO terms appear more often than expected.
GO works best when you have a clear DEG list and want broad biological interpretation for a Results section.
A simple way to think about GO is that it provides the job descriptions of your genes.
KEGG Pathway Analysis: How Do Genes Work Together?
KEGG looks at pathways rather than individual functions. These pathways include metabolic routes, signaling cascades, and disease-related networks.
Instead of abstract terms, KEGG gives concrete pathways such as glycolysis, MAPK signaling, or T-cell receptor signaling, often with diagrams showing how genes interact.
KEGG enrichment is also commonly performed using ORA. In this case, it asks whether a pathway contains more DEGs than expected.
KEGG is most useful when you want mechanistic insight and when pathway structure and gene interactions matter.
A helpful way to think about KEGG is as a wiring diagram of the cell.
GSEA: Are Pathways Shifting Even If No Genes Scream?
Gene Set Enrichment Analysis (GSEA) takes a completely different approach.
Instead of starting with a DEG list, GSEA uses all genes from the experiment, ranked by expression change. It then asks whether genes from a given pathway or functional group tend to appear near the top or bottom of that ranked list.
There are no hard cutoffs and no requirement for individual genes to be strongly significant.
GSEA is especially powerful when:
- Fold changes are modest
- Few genes pass DEG thresholds
- Biology is driven by coordinated regulation rather than on-off changes
A classic example is inflammation. Many inflammatory genes may change slightly, but together they form a strong biological signal that GSEA can detect even when ORA cannot.
A good way to think about GSEA is that it detects the overall state or mood of the transcriptome.
The Key Difference: ORA Versus GSEA
The most important distinction is not GO versus KEGG versus GSEA. It is ORA versus GSEA.
ORA works by selecting a small set of genes and asking which pathways are over-represented. As a result, ORA results are usually driven by a small number of strongly changing genes.
GSEA works by examining all genes and asking whether many genes from the same pathway shift together. As a result, GSEA results are driven by dozens or hundreds of genes showing coordinated but modest changes.
This explains why GSEA often produces stronger and more consistent enrichment results than ORA in complex datasets.
Choosing the Right Tool
- Use GO enrichment when you want functional categories and broad biological summaries.
- Use KEGG enrichment when you want pathway-level mechanisms and interpretable diagrams.
- Use GSEA when changes are subtle, DEG lists are small, or you suspect system-level regulation.
In practice, the best analyses do not choose one method. They combine them.
- GO helps identify what functions are changing.
- KEGG helps explain how pathways are affected.
- GSEA reveals whether entire biological systems are shifting together.
If GO is the dictionary, KEGG is the circuit diagram, and GSEA is the overall mood of the cell.
Using all three turns RNA-seq results from a list of genes into real biological understanding.
Practical Implementation
I’ve created a comprehensive R workflow that implements all three enrichment methods side-by-side. This allows you to:
- Compare results across methods to see which pathways each method identifies
- Understand the scale differences - ORA methods typically find pathways with 5-20 genes, while GSEA finds pathways with 50-200+ genes
- Get complementary insights - ORA finds specific “needles” while GSEA finds coordinated “haystacks”
The workflow includes:
- GO enrichment using ORA
- KEGG enrichment using ORA
- GSEA with GO gene sets
- GSEA with KEGG pathways
- Side-by-side comparison visualizations
- Publication-ready tables and plots
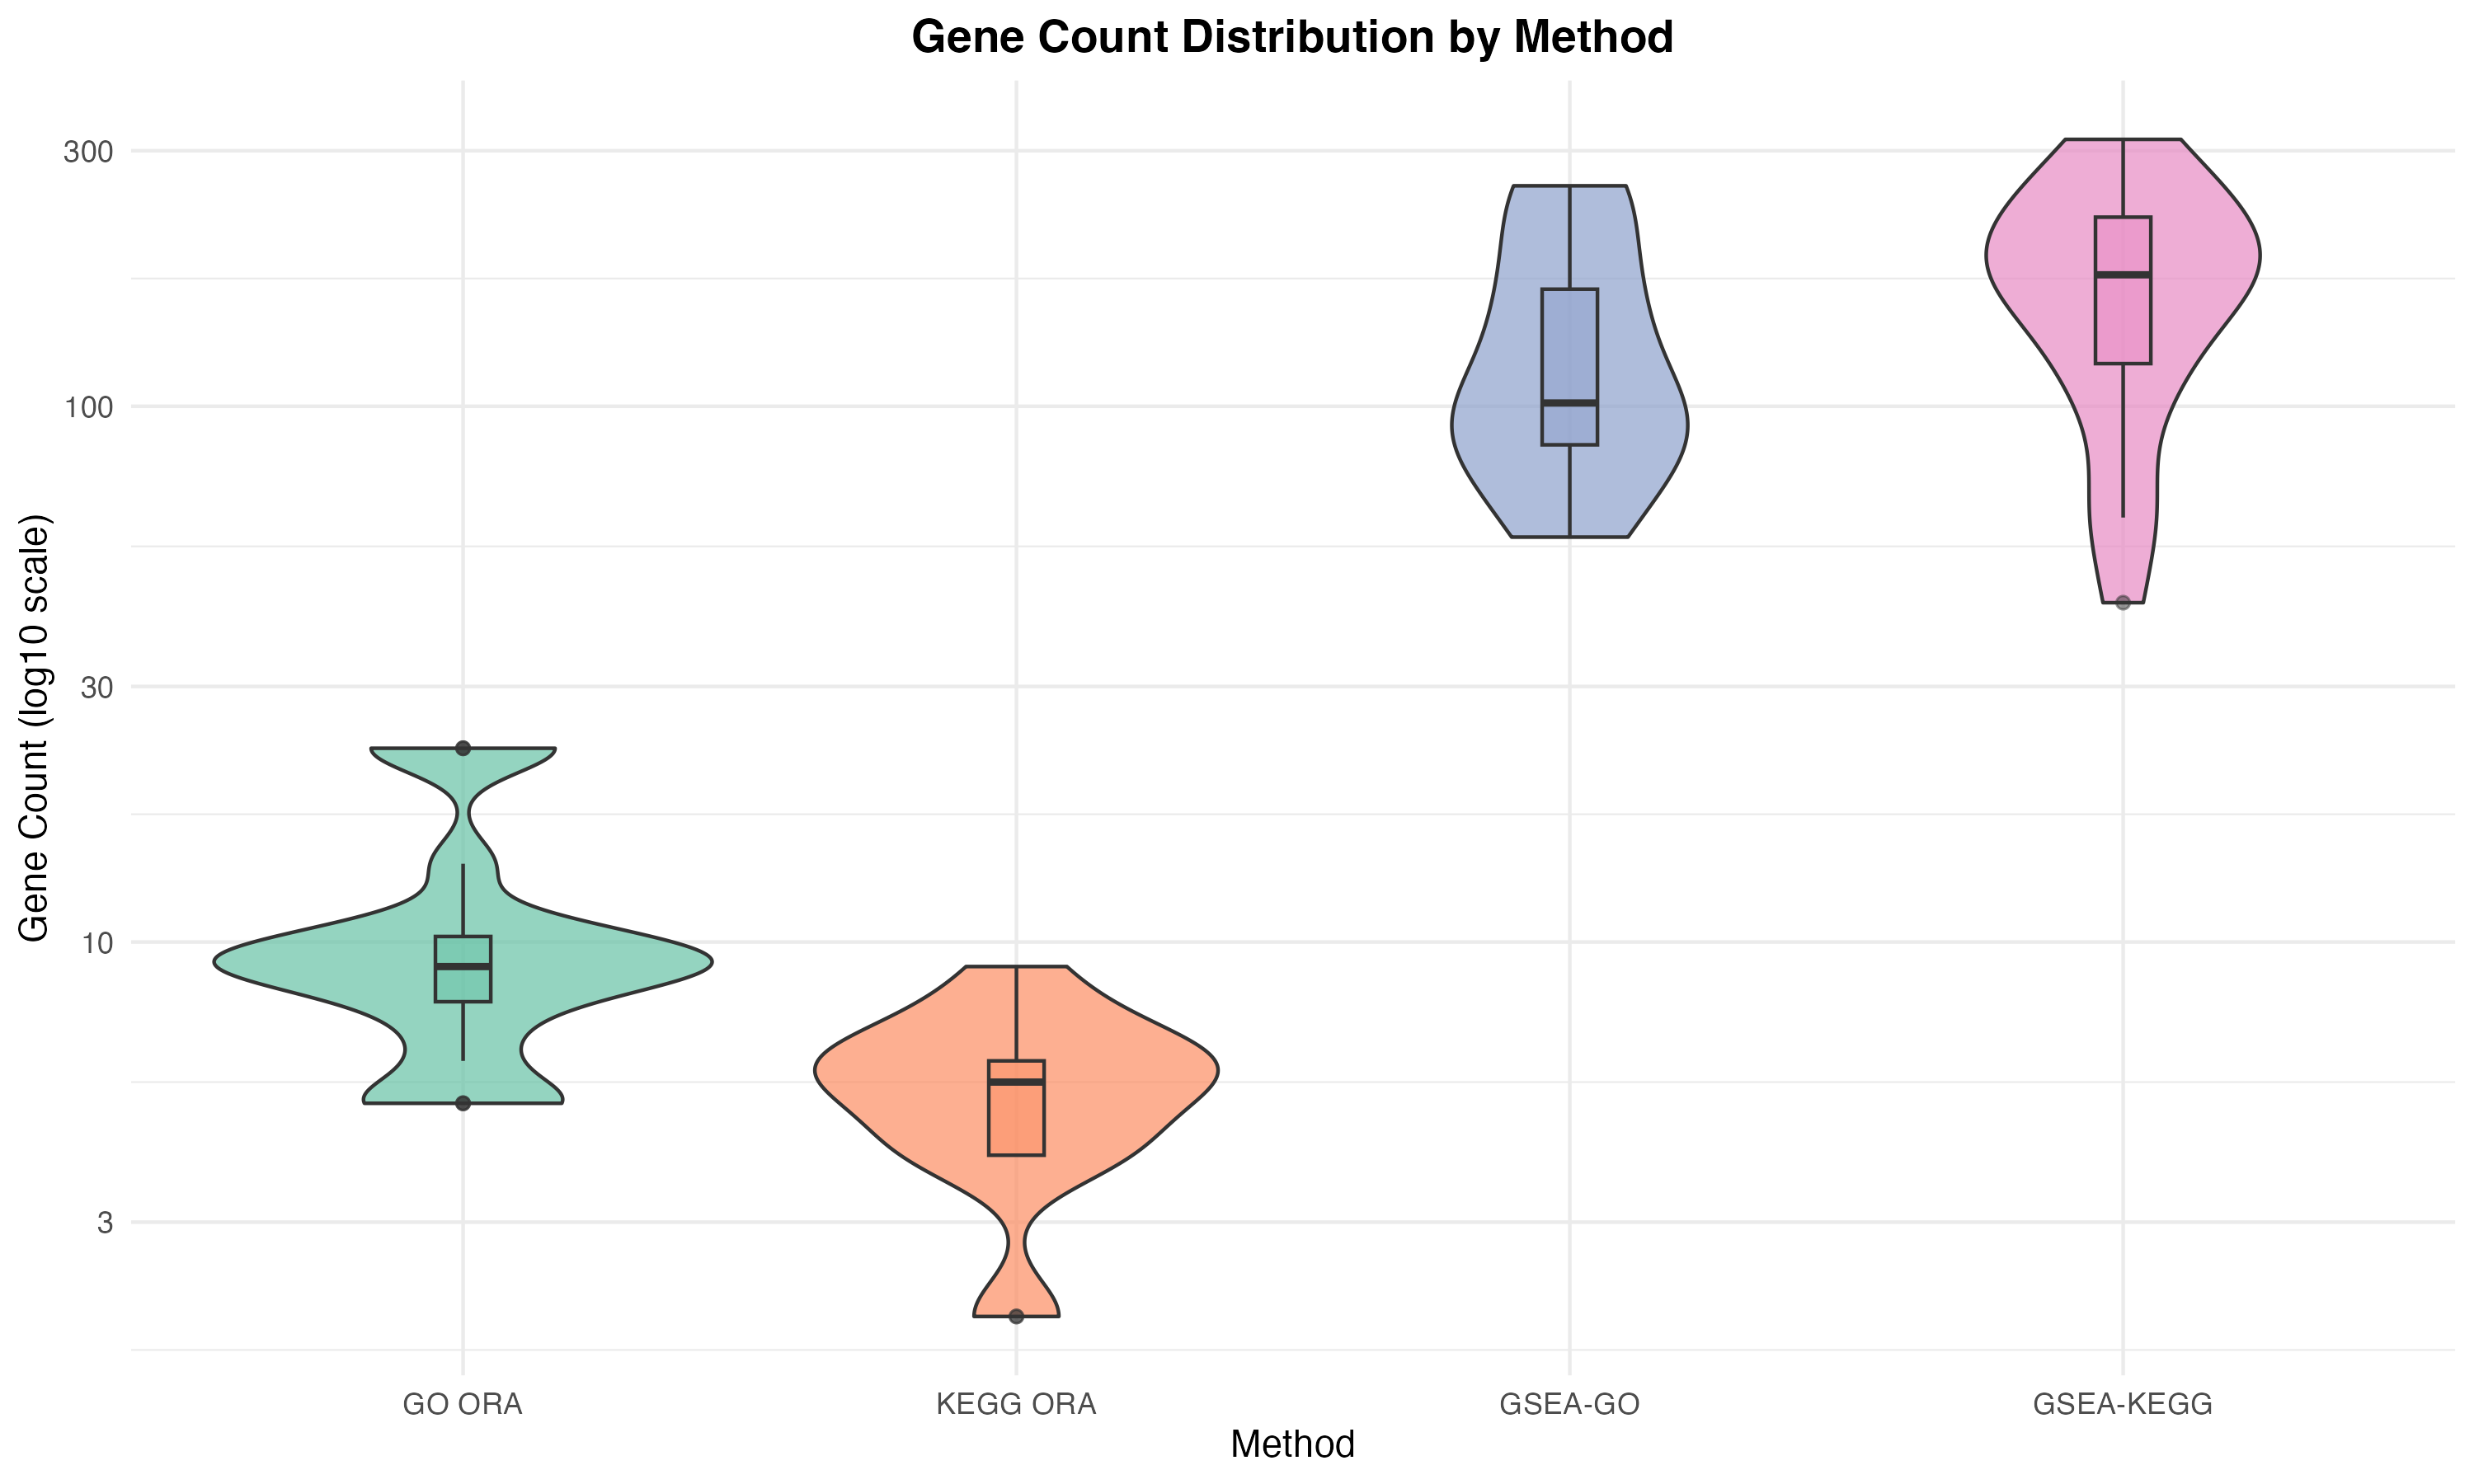 Figure 1: Gene count distribution across enrichment methods. GSEA methods identify pathways with 10-20x more genes than ORA methods, reflecting their ability to capture coordinated changes across large gene sets.
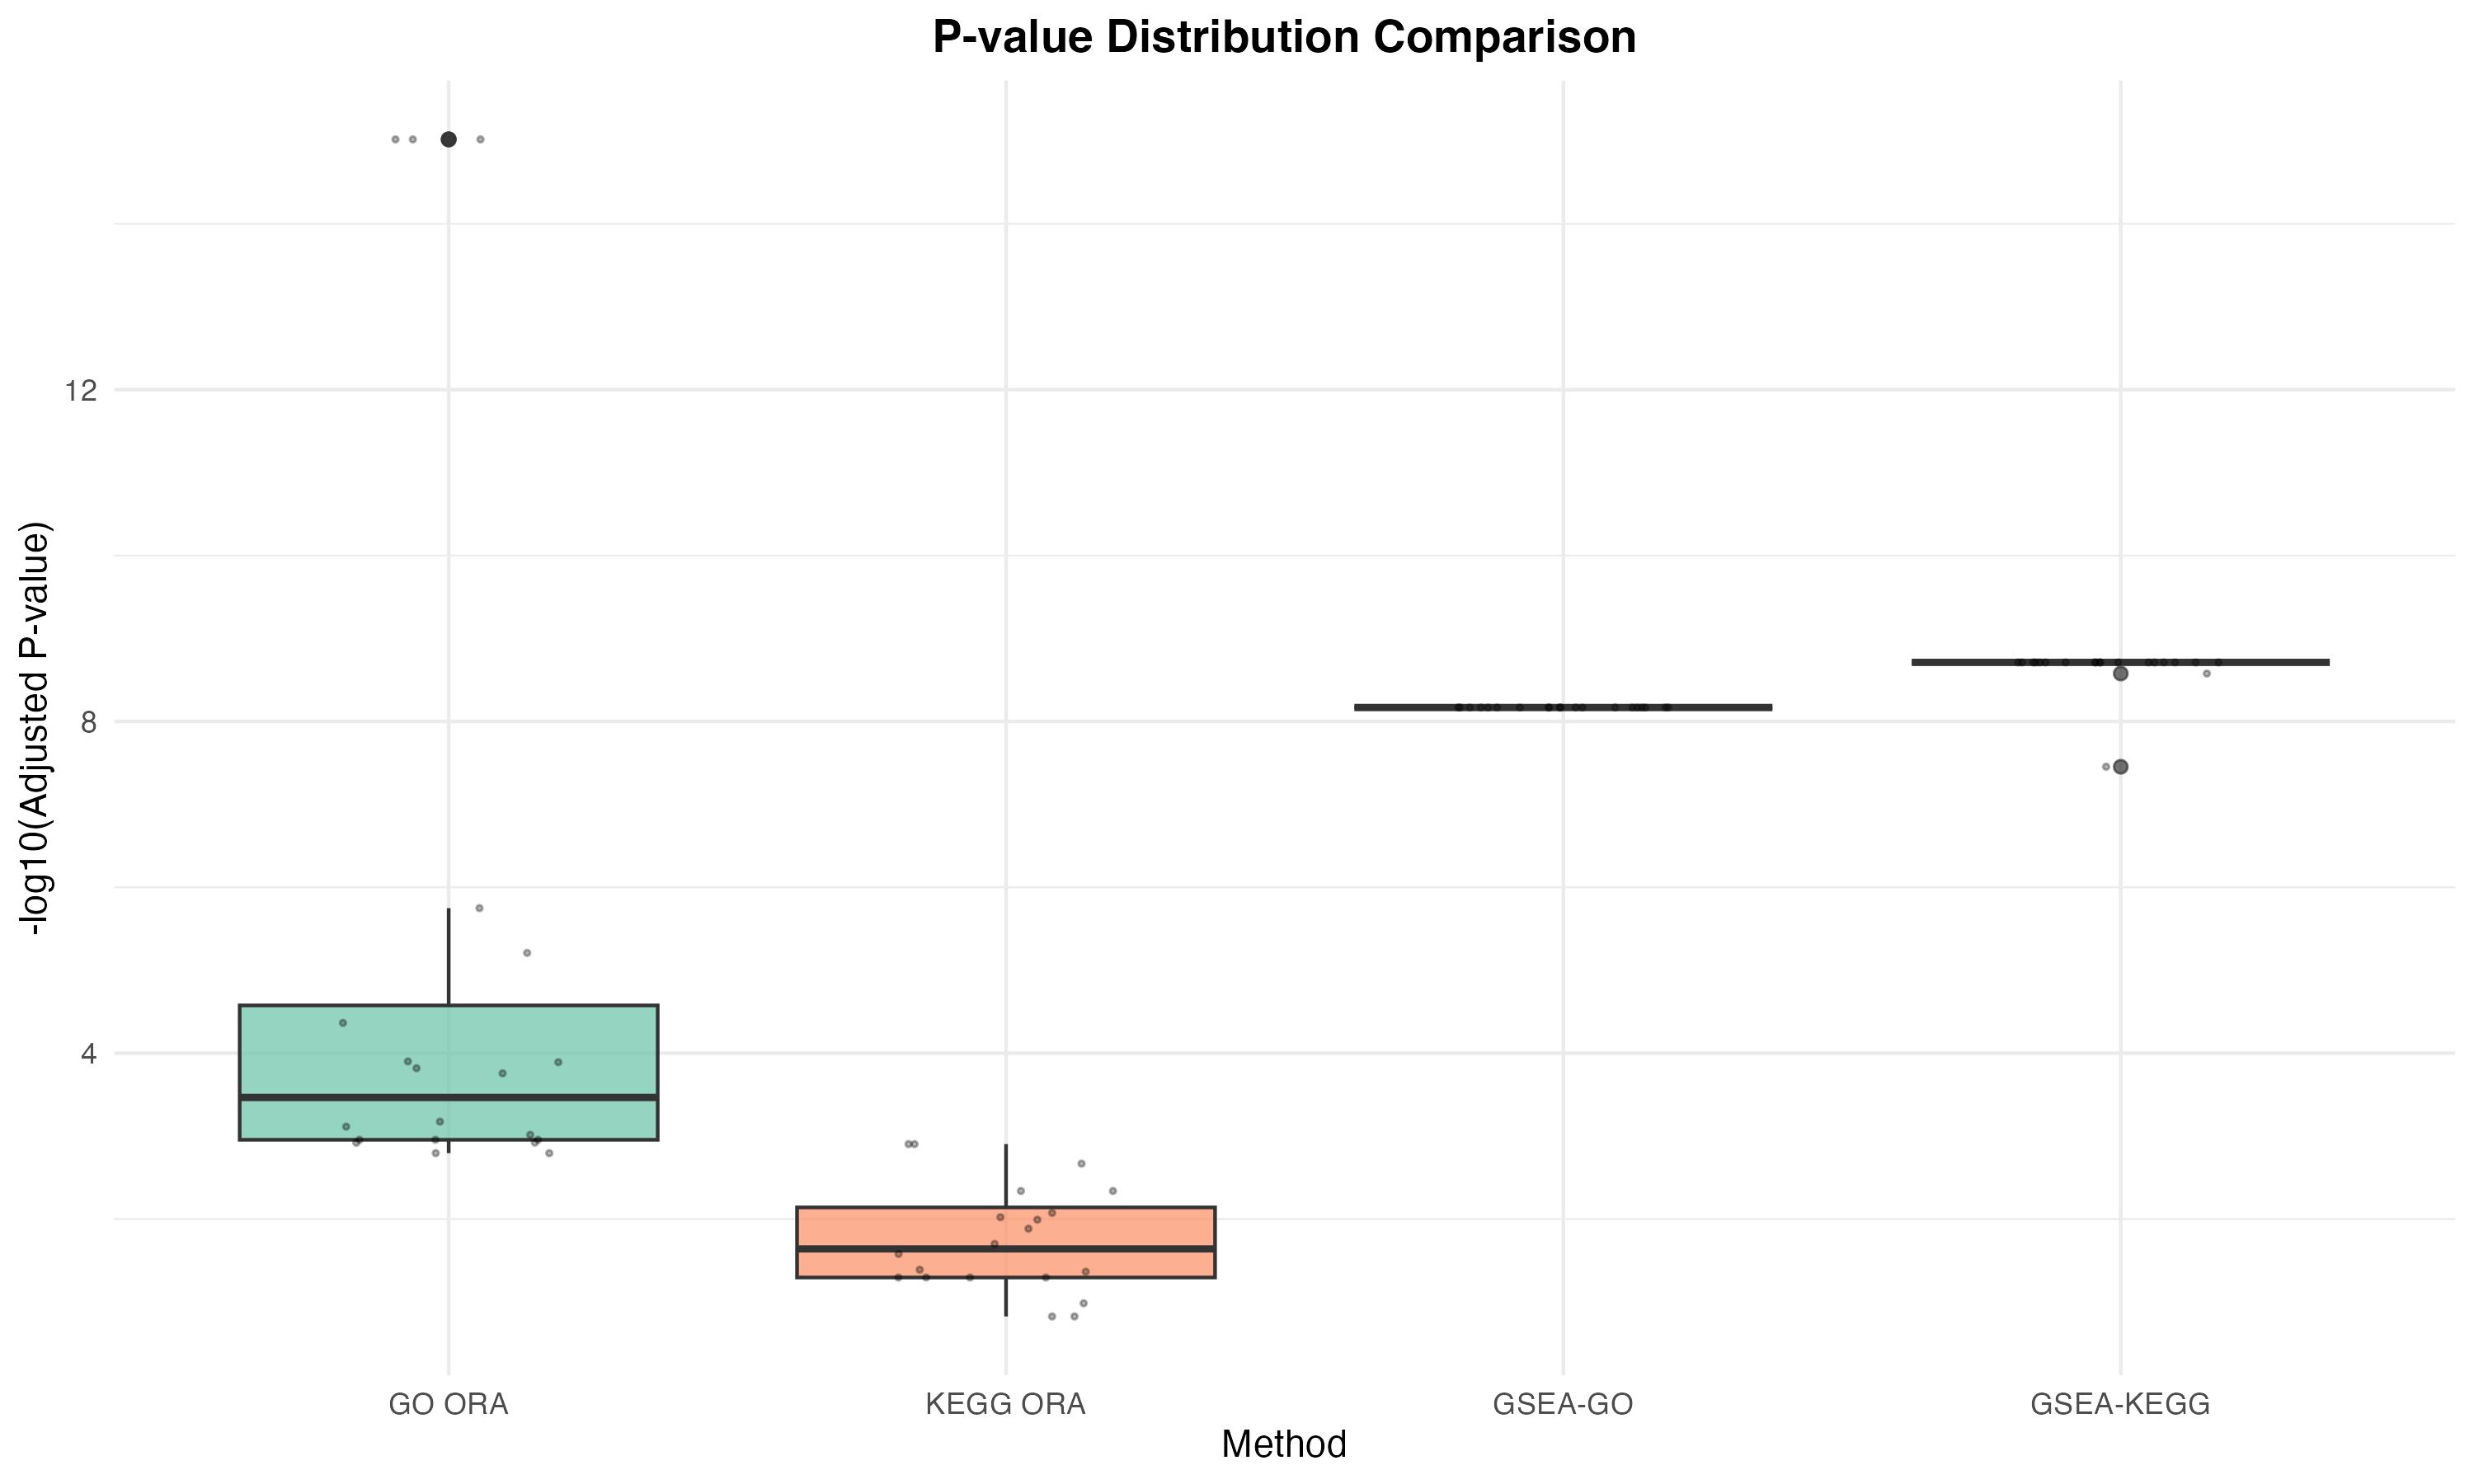 Figure 2: P-value distribution comparison showing the significance of pathways identified by each method.
Key Insights from the Analysis
Direct comparison of enrichment strategies revealed that DEG-based ORA and rank-based GSEA capture fundamentally different regulatory signals. While GO and KEGG ORA detected only a limited number of moderately significant terms, GSEA identified robust and highly significant enrichment across both ontologies and pathways. This discrepancy reflects a transcriptional landscape characterized by widespread, coordinated modulation of gene sets rather than isolated, high-magnitude gene expression changes. Consequently, GSEA provides a more sensitive and biologically informative representation of the underlying regulatory programs active in this condition.
Scale Differences
ORA Methods: Typically identify pathways with 5-20 genes per term/pathway
- Focused, specific biological functions
- Best for identifying key driver genes
GSEA Methods: Typically identify pathways with 50-200+ genes per term/pathway
- Broad, coordinated biological programs
- Best for detecting subtle but system-wide changes
When to Use Each Method
Use ORA methods when:
- You have clear, strong differential expression
- You want to identify specific genes and functions
- You need focused, interpretable results
Use GSEA methods when:
- You have subtle but coordinated changes
- You want pathway-level insights
- You need to detect changes that might not pass strict DEG thresholds
Complete Workflow Available on GitHub
I’ve made the complete analysis workflow available on GitHub, including:
- Full R Markdown analysis script
- Step-by-step documentation
- Example visualizations
- Comparison analyses
- All code is reproducible and well-documented
🔗 View the complete workflow on GitHub
The repository includes:
- Complete R Markdown workflow
- Data preparation scripts
- Visualization code
- Results tables
- All generated plots and figures
Conclusion
Functional enrichment analysis is not about choosing one method over another. It’s about understanding what each method tells you and using them together to build a complete picture of your RNA-seq data.
- GO tells you what functions are changing
- KEGG tells you how pathways are affected
- GSEA tells you whether entire systems are shifting
Together, they transform a list of differentially expressed genes into meaningful biological insights.
References
Ashburner, M., Ball, C. A., Blake, J. A., et al. Gene ontology: tool for the unification of biology. Nature Genetics, 25(1), 25–29 (2000). https://doi.org/10.1038/75556
Kanehisa, M., & Goto, S. KEGG: Kyoto Encyclopedia of Genes and Genomes. Nucleic Acids Research, 28(1), 27–30 (2000). https://doi.org/10.1093/nar/28.1.27
Subramanian, A., Tamayo, P., Mootha, V. K., et al. Gene set enrichment analysis: A knowledge-based approach for interpreting genome-wide expression profiles. Proceedings of the National Academy of Sciences (PNAS), 102(43), 15545–15550 (2005). https://doi.org/10.1073/pnas.0506580102
Liberzon, A., Birger, C., Thorvaldsdóttir, H., Ghandi, M., Mesirov, J. P., & Tamayo, P. The Molecular Signatures Database (MSigDB) hallmark gene set collection. Cell Systems, 1(6), 417–425 (2015). https://doi.org/10.1016/j.cels.2015.12.004
Yu, G., Wang, L.-G., Han, Y., & He, Q.-Y. clusterProfiler: an R package for comparing biological themes among gene clusters. OMICS: A Journal of Integrative Biology, 16(5), 284–287 (2012). https://doi.org/10.1089/omi.2011.0118
Love, M. I., Huber, W., & Anders, S. Moderated estimation of fold change and dispersion for RNA-seq data with DESeq2. Genome Biology, 15(12), 550 (2014). https://doi.org/10.1186/s13059-014-0550-8
Korotkevich, G., Sukhov, V., Budin, N., et al. Fast gene set enrichment analysis. bioRxiv (2019). https://doi.org/10.1101/060012 (Implemented as the fgsea R package)
Alexa, A., & Rahnenführer, J. topGO: Enrichment analysis for Gene Ontology. Bioconductor Package (2019).
Have questions about enrichment analysis or want to discuss your RNA-seq workflow? Feel free to reach out or check out the complete analysis on GitHub!